Spectrogram & Melspectrogram
This file shows how RytmForge library could generate a spectrogram of an audio file. For convenience this examples uses librosa.examples and librosa.load functions to load audio from the Internet. On your local machine you could use rythmforge.load.load function to load any .wav file.
Load an example audio file .. code-block:: python
y, sr = librosa.load(librosa.ex(‘brahms’))
Compute STFT matrix that is used in both spectrogram and melspectrogram .. code-block:: python
S = rythm_forge.core.stft(y, n_fft=2048, hop_size=512)
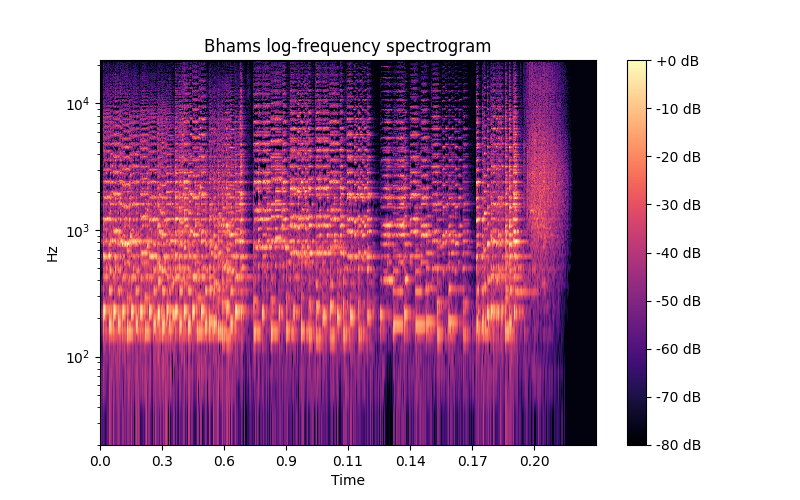
Spectrogram
Display the power spectrogram:
S_dB = rythm_forge.core.amplitude_to_dB(np.abs(S), np.max(S)).astype(np.float64)
fig, ax = plt.subplots(figsize=(8, 5))
img = rythm_forge.display.spectrogram(S_dB, yaxis="log", ax=ax)

fig.colorbar(img, ax=ax, format='%+2.0f dB')
ax.set(title='Bhams log-frequency spectrogram')
plt.show()
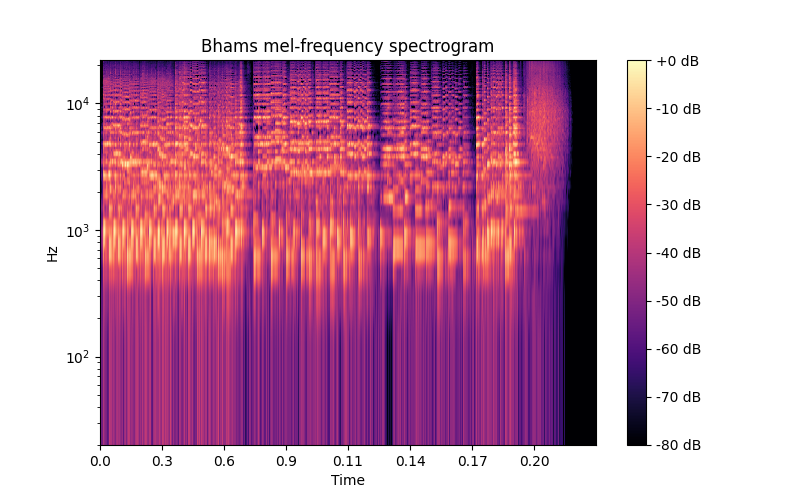
Melspectrogram
S_dB = rythm_forge.core.power_to_dB(S, ref=np.max)
fig, ax = plt.subplots(figsize=(8, 5))

img = rythm_forge.display.spectrogram(S_dB, yaxis="log", ax=ax)
fig.colorbar(img, ax=ax, format='%+2.0f dB')
ax.set(title='Bhams mel-frequency spectrogram')
plt.show()